Graphing
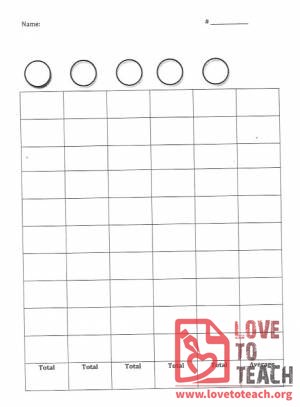
Can be used for a variety of things; for example, a behavior chart to track behavior for the week or possibly use as a bar graph, etc.
This graph can be used more than one way! A great way to introduce many math concepts.
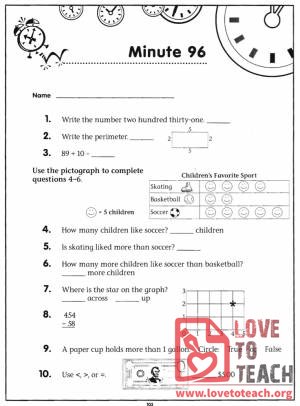
This review sheet has a little bit of everything! Perimeter, pictographs, and more!


Ice cream observations has several activities for the students to complete. All the activities are ice cream based.

Chicken pox becomes an important topic of discussion during the late winter and early spring as children begin to contract it. On this graph, children can compare how many of them have or have not had the chicken pox. The graph can be used in conjunction with the book Betsy and the Chicken Pox by Gunilla Wolde.

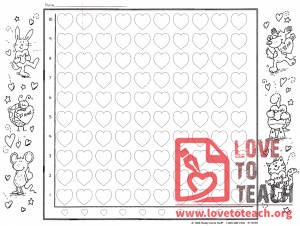
Each child chooses one favorite ice cream flavor, and the selections are then graphed. Instead of bars, this graph uses circles so that the columns look like giant ice cream cones.

Children taste three types of apples: granny smith, red delicious, and golden delicious, and select their favorite. The results are recorded on a graph.

This graph reinforces identity issues. Each child decides which column is closes to his or her hair color.

Children vote for their favorite main character, the Page or the King, from King Bidgood's in the Bathub by Audrey Wood

Children always seem to be interested in their shoes. For this graph they are asked how their shoes fasten. Used in connection with book "I Went Walking" by Sue Williams.